Karla Rubio-Sandoval et al (including me!) have published a massive dataset of paleo sea level data for the east coast of South America. This came out in the April 2026 issue of Global and Planetary Change. This dataset focuses on the Holocene sea level history of the coast, where an extensive records have been collected for many decades. These data have been included in the WALIS database and follows the protocols of the HOLSEA project.
This paper is in some ways a successor to a compilation of paleo sea level data for the last interglacial in southeastern South America, which I was the lead author of back in 2021 (Karla did the compilation for northeastern South America). When I left Germany in 2021, I handed Karla a big pile of papers I had printed out for that project, which included many of the data that have been entered into the dataset.
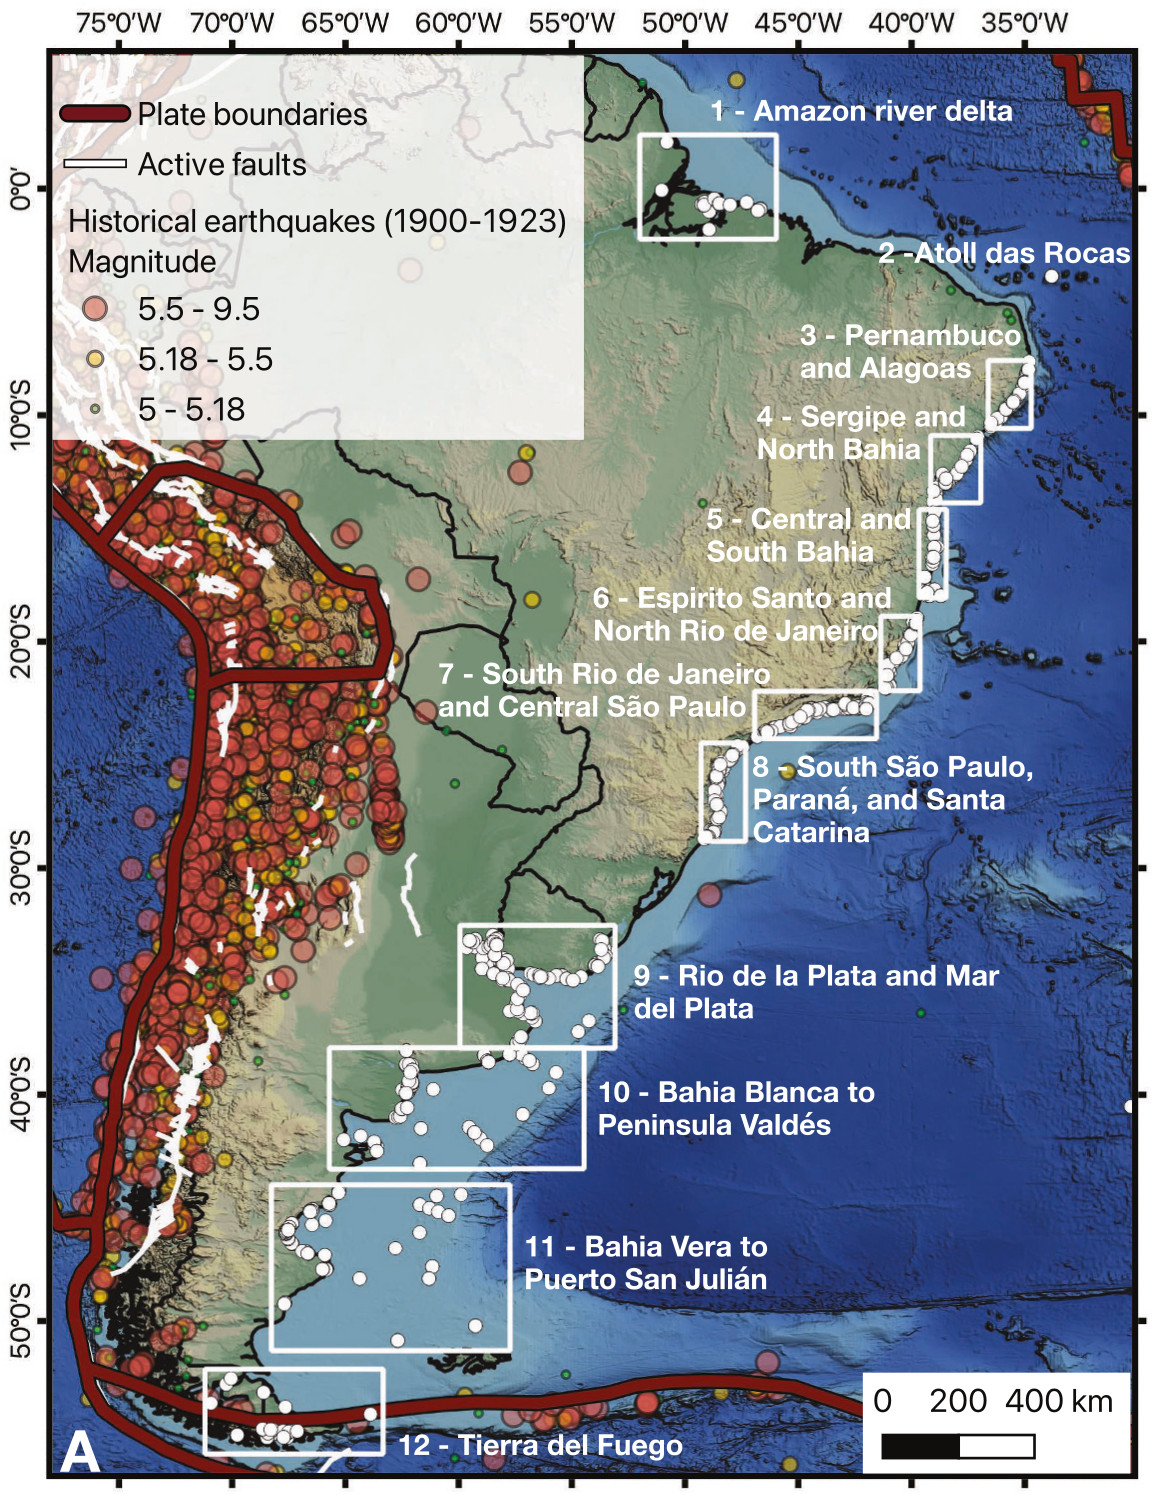
The dataset has coverage of most of the coast of South America from northern Brazil to the south end of Tierra del Fuego in Chile and Argentina. If you look at the map above, one particular characteristic of this coast is a lack of large earthquakes. The Atlantic coast of South America is considered to be tectonically stable. This means that this area should be recording global sea level change processes rather than local land motions.
In total, there are 1108 data points in this dataset. Of these, 701 are sea level indicator points (SLIPs). These are the best data, because they constrain the position of past sea level to a specific elevation range. There are also 100 terrestrial limiting points. These tell you that sea level was lower than the elevation of the sample. There were 307 marine limiting points, which tell you that sea level was higher than the elevation of the sample.
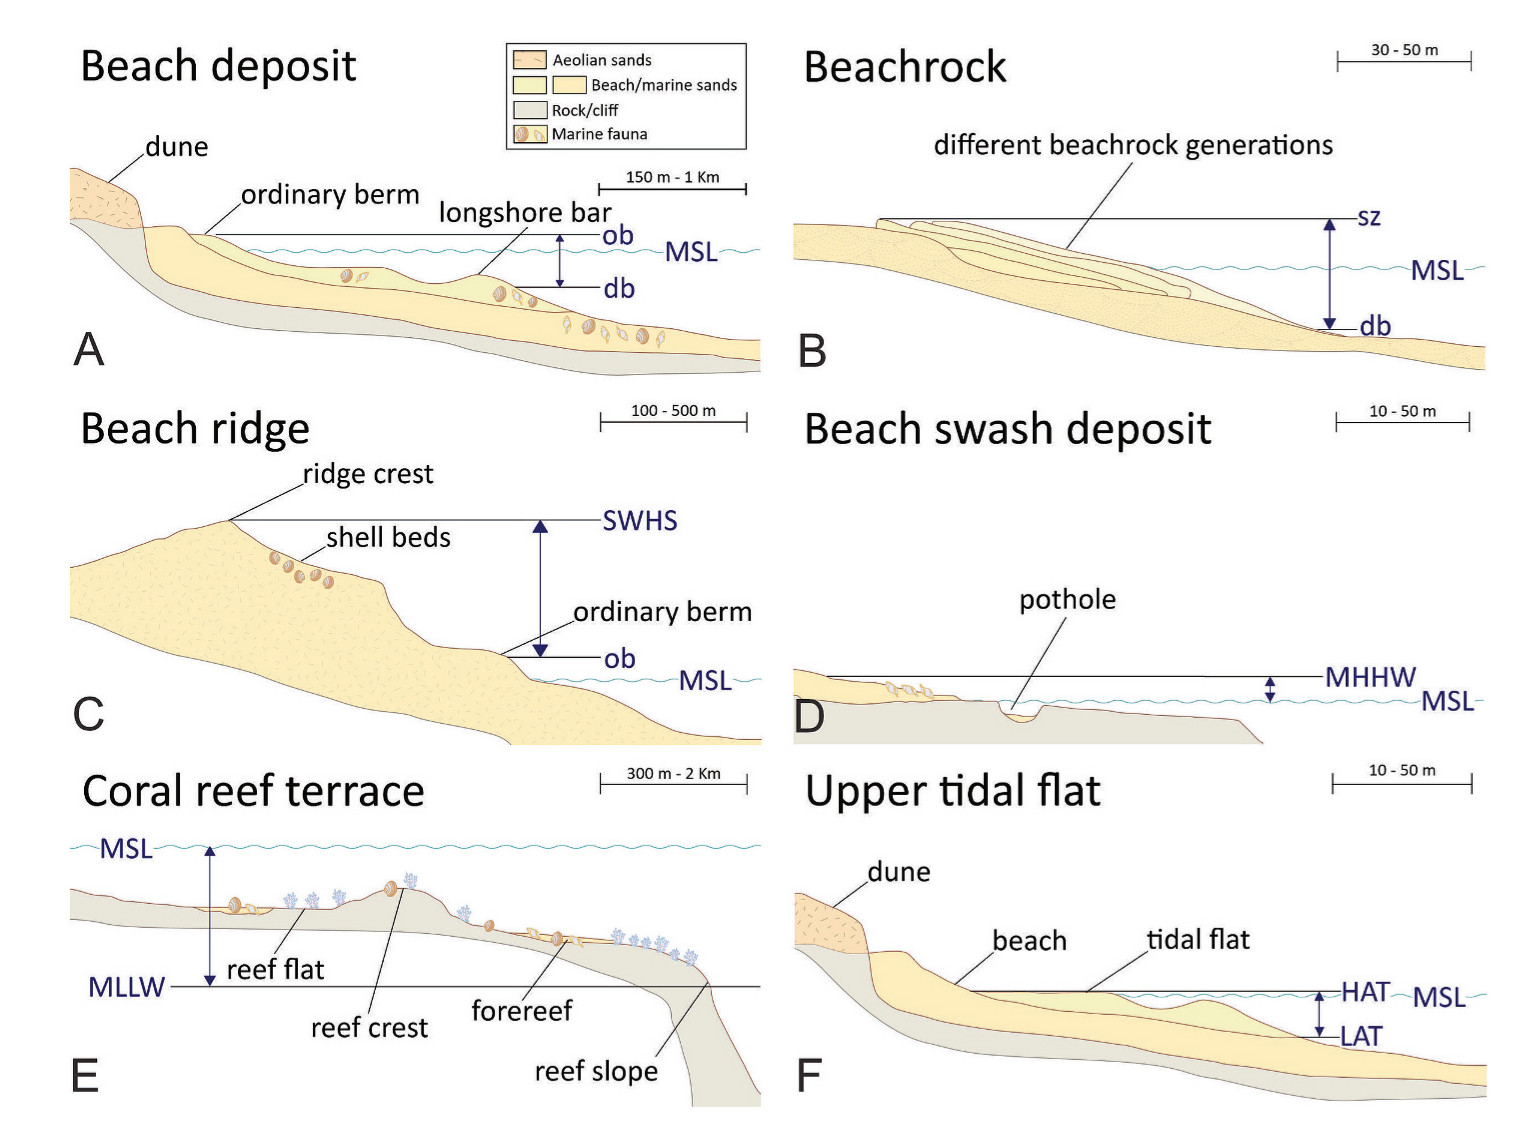
One of the really great things about this paper is that there are a bunch of schematic diagrams explaining how different landforms can be used to determine past sea level position. Truly textbook level stuff.
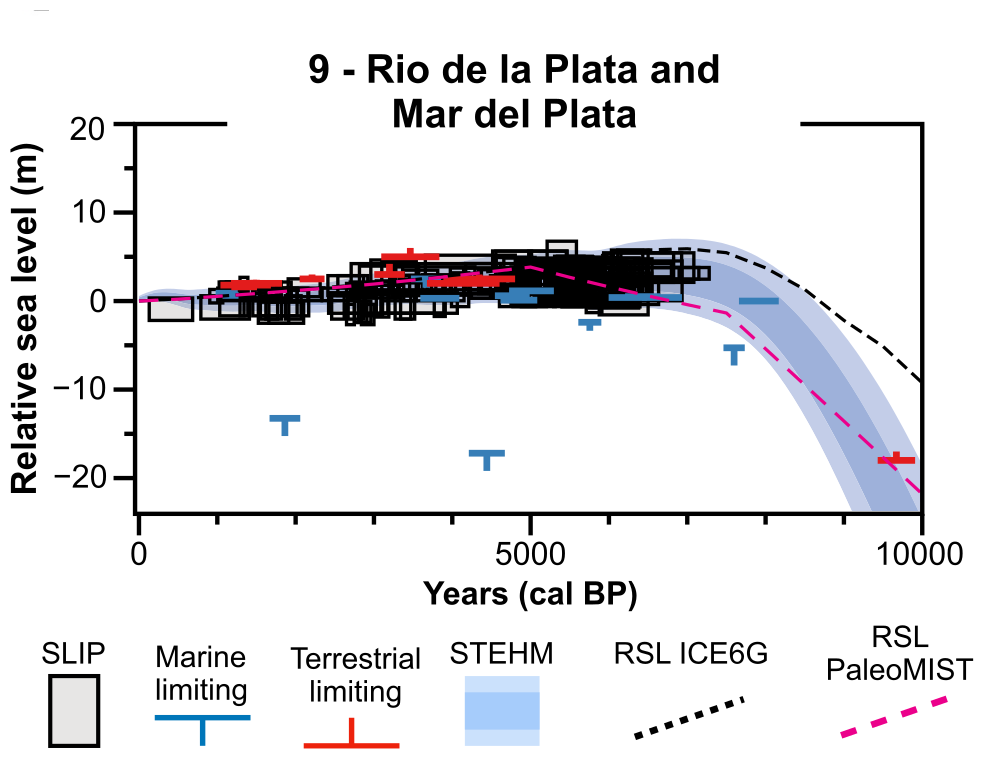
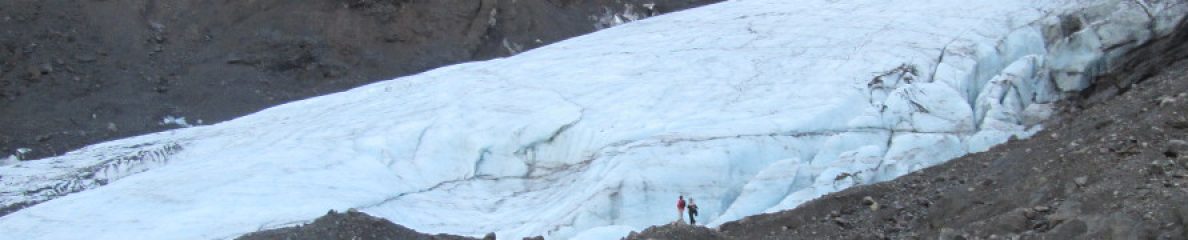
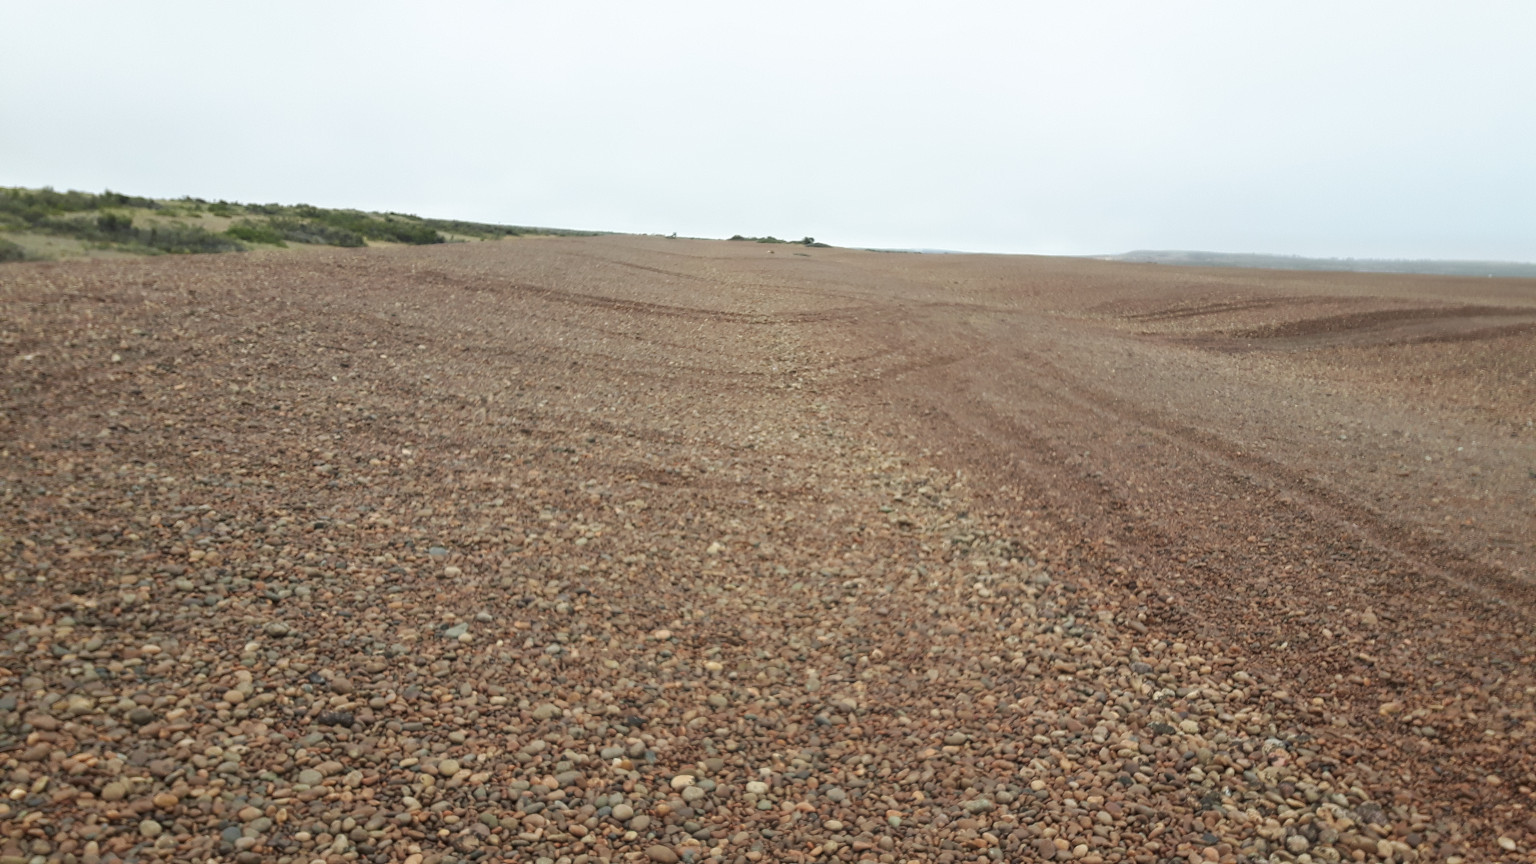
One of the reasons there is so much data in South America is that along much of the coast, sea level was higher than present in the middle Holocene. In many places along the coast, there was a sea level highstand of several meters above present, which happened between 4000 and 8000 years ago. After the highstand, there has been a steady decline in sea level. I saw this when I went on my fieldwork trip to Argentina. You could clearly measure the decreasing elevation of beach ridges towards the modern coastline in places like Camarones (which is where I took the picture at the top of the article).
The primary reason for this pattern of a mid-Holocene highstand with a gradual decline to the present is a result of glacial isostatic adjustment (GIA). During the last glacial cycle, ice sheets built up in North America and Europe. This attracted ocean water towards the Northern Hemisphere. Those ice sheets melted away and that water flowed back to the Southern Hemisphere. It is not a coincidence that the Holocene highstand happened at the same time that the ice sheets finished melting. After that, the Earth continued to deform, as the rocks deep below the surface that had been pushed away due to the weight of the ice sheets flowed back to where the ice was. This changes the volume of the Northern Hemisphere oceans, allowing it to take up more water volume and lowering sea level in places far from where this process is happening. There has also likely been a bit of sea level fall due to advances in the Greenland Ice Sheet during the past few thousand years.
In the paper, we compared a few models of sea level. ICE-6G was developed and assessed against the data from the east coast of South America, and it does well in matching the observations. PaleoMIST was developed by me. The model does not fit the data prior to 5000 years ago very well, in part because it has a low temporal resolution with 2500 year time steps. There is room for improvement in future versions of my model. The STEHM statistical model, which incorporates both data and sea level models in its construction, provides a satisfactory fit to the data.
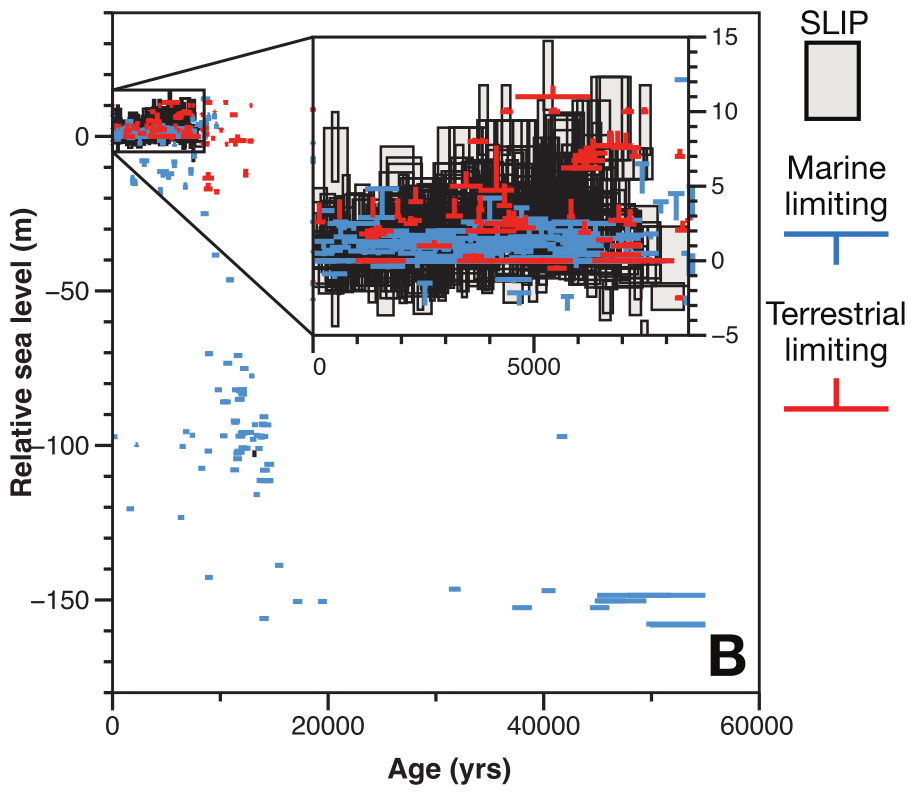
Once thing I requested Karla to do was to compile the data that is from sediment cores taken from the continental shelf. These data stretch out to the Last Glacial Maximum, a time when there are few constraints on past sea level. I am very thankful that these data are included in the dataset, which I will use to assess my future ice sheet modelling efforts.
Perhaps a paper like this is not a mind-blowing advance in terms of science, but compilation efforts like this are absolutely essential to create better models of the past sea level, ice sheets, topography and climate. Prior to the efforts of the HOLSEA and WALIS projects, sea level data were often scattered in papers, and not in a digital format. I have slowly been putting all these datasets in my GAPSLIP database, which facilitates comparisons to modelled sea level and these data. I will hopefully be adding this new database sometime later this year!
I have to congratulate Karla on this paper. This compilation was part of her PHD, which was done during the coronavirus pandemic. It could not have been easy. This compilation involved sorting through a large number of papers and interpreting the previously collected data to modern standards. Having done this with the last interglacial data, this it not always an easy task! This paper will be a standard reference for sea level studies in South America for years to come.

You must be logged in to post a comment.